Data Acquisition History — From Strip Chart Recorders to Digital Data Acquisition
Most people are familiar with the concept of data recording. If you’ve seen films from the early days of NASA, you might have seen banks of paper-based chart recorders, endlessly streaming out squiggly lines. These were the days before graphical video displays. Paper was the easiest way to provide a real-time display of measured signals.

You might also have seen EEG, EKG machines, also with paper outputs, which display and commit to paper medical readings, as well as seismographs, which draw lines to represent earthquake data.
In the earliest days of testing, readings from meters had to be written by hand onto paper, and then the results analyzed off-line. Eventually, technology allowed measurements to be recorded on tape, and then onto a continuous chart using a pen. Magnetic tape and paper-based chart recorders were the dominant methods of recording scientific data until the 1980s.
We consider tape and chart paper recorders to be the precursors of today’s digital data acquisition devices.
Jump to a section
What is a Data Acquisition System
The First Data Acquisition Systems
The Era of Strip Chart Recorders
The First PC-based Data Acquisition
The Paper Chase — How Paper-based Recorders Responded to Digital DAQ Systems
Top 10 Data Acquisition Companies Today
What is a Data Acquisition System?
We define a data acquisition system as a device (DAS or DAQ device) that converts analog electrical signals from physical phenomena into the digital domain and then utilizes a computer for data visualization, storage, and analysis, under the control of associated software.
In other words, DAQ converts analog waveforms into digital data. When analog signals are converted into digital data they can easily be manipulated by a computer running software.
Common Terms Used in Describing Data Acquisition Systems Include:
- DAS or DAQ — a common abbreviation of the term “data acquisition”
- Scientific Measuring Instrument — an instrument which measures and records physical phenomenon such as strain, pressure, vibration, temperature, and more.
- Analog Signals — physical phenomena from the real world, such as voltage, current, strain, pressure, vibration, temperature, and more.
- Input and Output — typically modern digital data acquisition systems have several inputs and outputs. Input can be counted as an individual channel in which a certain signal or data can be read from. In a similar way, the output is used to feed data to other devices or systems.
- Derived Signals — measurands which are derived from two or more other properties, such as force, which is calculated as the product of mass multiplied by acceleration
- Signal Conditioners — electronic preamplifiers which provide the interface between sensors and the data acquisition’s A/D converter. Also called signal conditioning circuitry.
Check out Dewesoft’s modern, digital data acquisition systems
Types Of Data Recorders
This article specifically refers to data recorders developed for scientific measuring applications, as used in industry, aerospace, automotive, and power testing fields. Among them include these basic types:
- Data Loggers
- Strip Chart Recorders
- Tape Recorders
- Light Beam Oscillographs
- Data Acquisition Systems
This article will focus on Data Acquisition (DAQ) Systems, although the other kinds of data recorders listed above are worth mentioning and are of course part of the history of data acquisition in general.
Data Loggers
Data Loggers are differentiated from DAQ systems in that they have slower sample rates, and are meant to record slowly changing data over a long period of time — days, weeks, months or even years. In addition, data loggers are typically much smaller, less expensive, and highly portable.
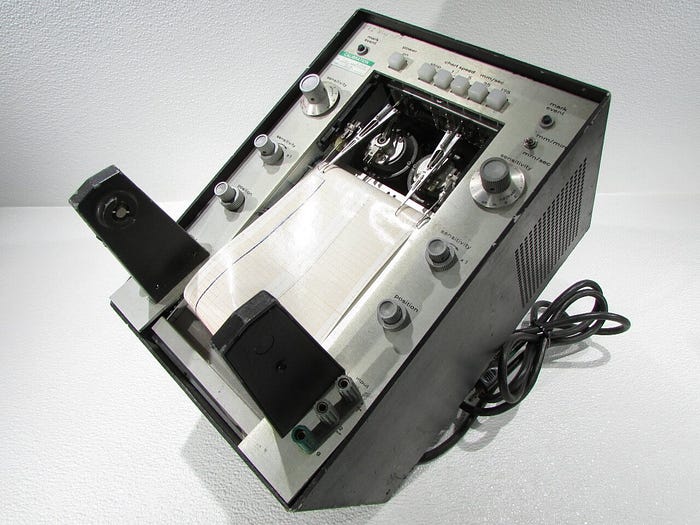
Strip Chart Recorders
Strip Chart Recorders, sometimes also referred to as oscillographic recorders, were originally based on moving pens which traced incoming signals on a moving chart. While faster than data loggers, they were still limited by the ability of the pen moving back and forth on a gridded width of the paper. This bandwidth was typically limited to 40 to 70 Hz or times per second.
Therefore, regardless of the analog bandwidth of the sensor of signal conditioning amplifiers, the strip chart recorder’s bandwidth was limited by the physics of moving a pen back and forth across a given width. Chart recorders were used frequently in parallel with computer-based DAQ systems, which originally lacked a real-time display.
Tape Recorders
Tape Recorders (used for instrumentation) offer bandwidth superior to paper-based strip chart recorders and offer long recording times. However, they have no real-time data display, except in some cases, where a numeric display is available. Tape systems were often used in parallel with strip chart recorders, prior to the advent of DAQ systems with real-time displays.
Light Beam Oscillographs
Light Beam Oscillographs was a solution when a paper-based recorder needed high bandwidth. Using a small mirror to aim a high-intensity beam of light as photosensitive paper, bandwidths much higher than strip chart recorders can be achieved.
The test duration is very short. Even 200 feet of paper does not last more than seconds at the speeds at which it is necessary to run it. Silver-based paper is extremely expensive and prone to fading upon exposure to ambient light.
The First Data Acquisition Systems
American computer company IBM developed computers in the early 1960s that were specifically intended to record scientific data. This started with the IBM 7700 Data Acquisition System, and it’s successor, the IBM 1800 Data Acquisition and Control System.
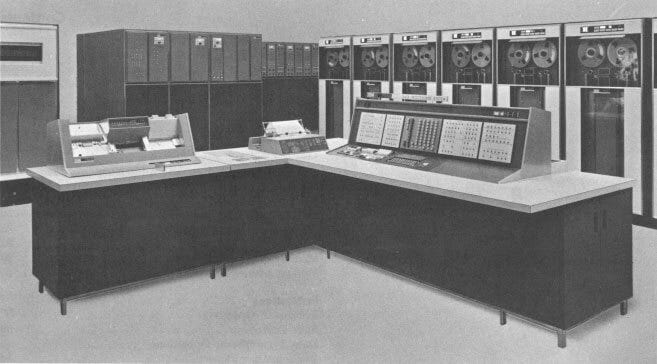
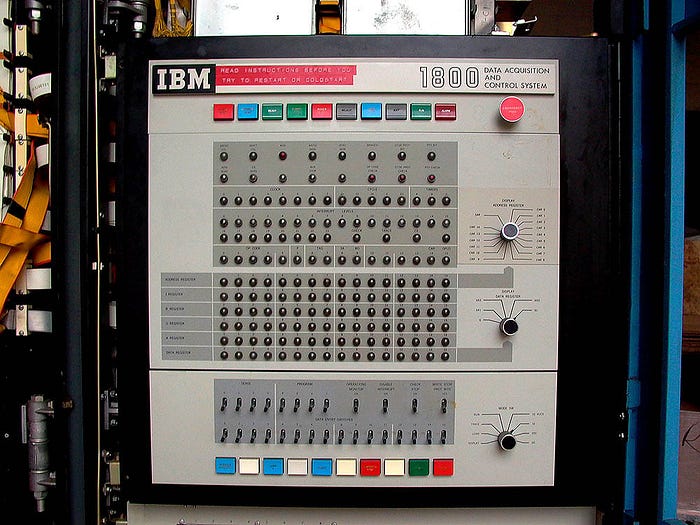
This is well before the advent of the personal computer (PC), so these systems were large scale and very expensive computers which required significant programming and setup in order to do their jobs. But they did represent a huge step forward in data recording, and they directly led to today’s PC-based data acquisition systems.
Due to their size, scale and cost these IBM data acquisition systems were used primarily by governments and very large government contractors, including NASA, various military branches, and their contractors.
The Era of Paper Strip Chart Recorders
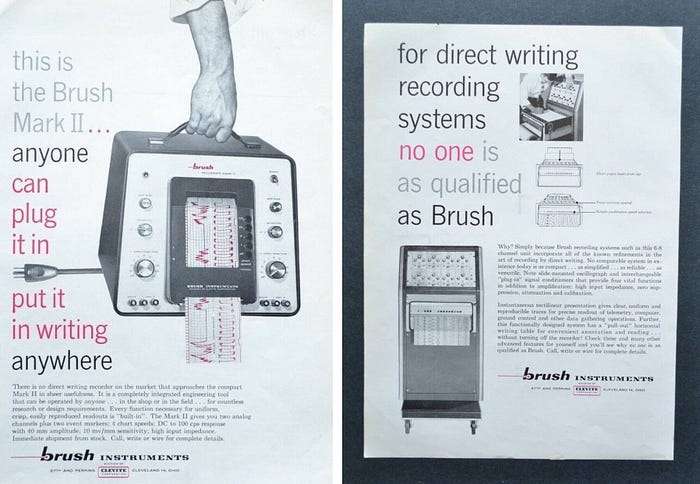
For the bulk of data recording and monitoring applications, chart recorders and tape recorders were the predominant products used. The most well-known paper chart recorder manufacturer in the 1960s was Brush, which became Brush/Clevite, and eventually Gould, Inc.
Also known as oscillographic recorders, these paper chart recorders were best typified for their pressurized ink system, in which moving styluses injected the ink under a thin layer of wax on the surface of a clay-based paper. The clear leader in ink-based systems, and in fact across all strip chart technologies, was Gould Electronics (later renamed Gould Instrument Systems).
Gould (formerly Brush — Clevite) was considered the “Cadillac brand” of paper recorders from the 1960s to the 1980s. They invested heavily in R&D and patented several important innovations, including their Metrisite® non-contact servo-loop system that improved accuracy and linearity. Gould later added thermal sensitive paper to its product line, to compete with companies making less expensive systems.
Gould was eclipsed during the 1990s by “upstart” brand Watanabe (later renamed “Graphtec Corporation”), a Japanese manufacturer who entered the market with thermal array pen models that were considerably less expensive than Gould’s offerings, and which was also very well built and reliable. Although the recordings made by thermal pens lacked the unrivaled appeal of Gould’s pressurized ink system, there was considerably less maintenance with them, hence time and money savings.
Another significant manufacturer in the early oscillographic paper recorder days was Sanborn, which was later bought by Hewlett-Packard. The company was best known for its thermal systems which used a heated stylus and thermally-sensitive paper to make lines on the moving paper.
Another upstart during the 1980s was Astro-Med, a Rhode Island-based maker of OEM recorders mostly for medical applications. They introduced their own end-user models for the general market and competed with Gould and Graphtec in the oscillographic recorder market, with some success.
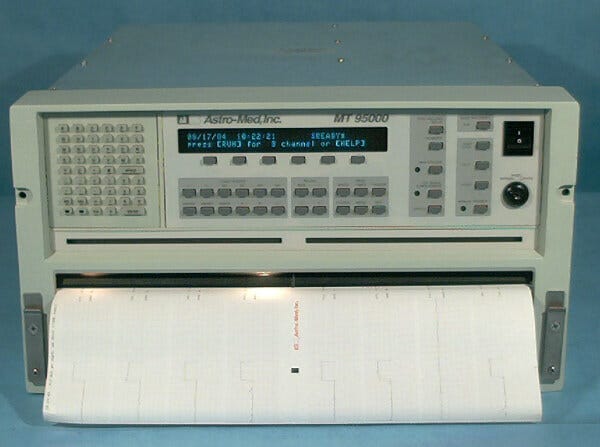
The Astromed MT95000 Recorder is an 8-channel recorder with laser-quality writing of 300 dpi, 20kHz frequency response, automatic self-calibration (traceable to NBS), data capture with 200kHz
Increasing the Bandwidth
Despite all of the improvements made to moving-pen systems, they still faced the inherent bandwidth limitation due to the mass of the pen (aka “stylus”) itself. A higher bandwidth solution was needed for numerous data acquisition applications.
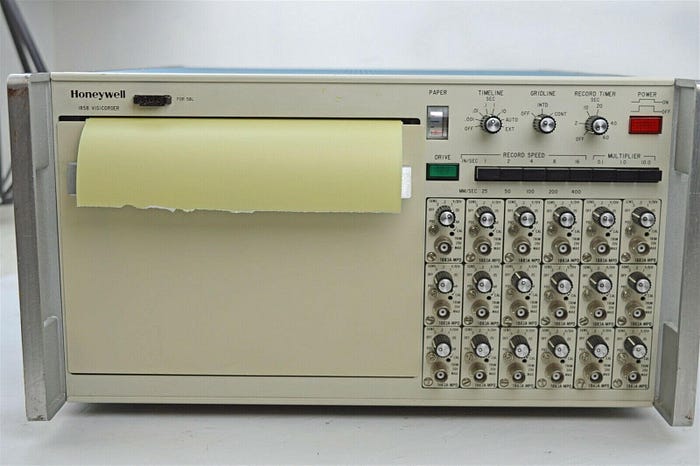
This led to the development of the light beam oscillograph (LBO) such as the 1858 Visicorder from Honeywell. These systems used a galvanometer to move a mirror very rapidly, which aimed a light beam at a light-sensitive paper. The very low mass of the mirror and high-speed paper motors allowed very high bandwidths to be achieved. The disadvantage was the very high cost of the light-sensitive paper, and its propensity to fade upon exposure to ambient light.
Transition to Tape Recorders
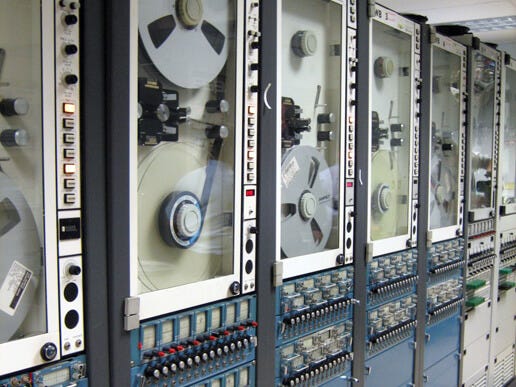
Tape recorders had the advantage of much higher bandwidth than the paper recorders, including the LBOs, but they had the disadvantage of not having a graphical display. Tape recorders could also run for extended periods of time.
FM (frequency modulated) tape recorders remained the best way to record large amounts of data for a very long time, from the 1960s through the 1980s. They are still in use today, although being increasingly replaced by PC-based data acquisition systems.
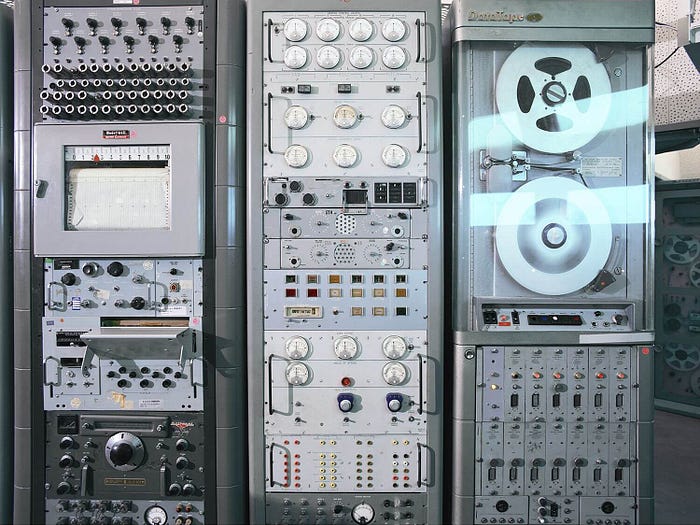
In mission-critical applications like those typified by NASA during the 1960s, tape recorders and paper chart recorders were used in parallel to provide the best qualities of each system, along with the mainframe computer systems such as the IBM 7700 and 1800.
These precursor technologies continued to develop throughout the 1970s and 1980s. The biggest technological enhancement was the replacement of moving styluses with the thermal array printheads that had been invented for the fax machine.
This increased the bandwidth dramatically by eliminating the need to move a pen back and forth. It came with the requirement to add a microcontroller and to digitize the data in order to send it to the printhead, which led to many accompanying enhancements, such as the ability to print text and other elements onto the paper.
The first company to successfully utilize a printhead in their paper recorders was Gould. They were followed by Watanabe (later known as Graphtec and Western Graphtec) and Astro-Med, Inc. (today is known as Astro-Nova, Inc.), among others.
The First PC-based Data Acquisition
By the mid-1980s, The USA company National Instruments Corporation was selling elemental components such as GPIB data acquisition cards and analog-to-digital converter boards (DAQ board) that could be installed into low-cost personal computers.
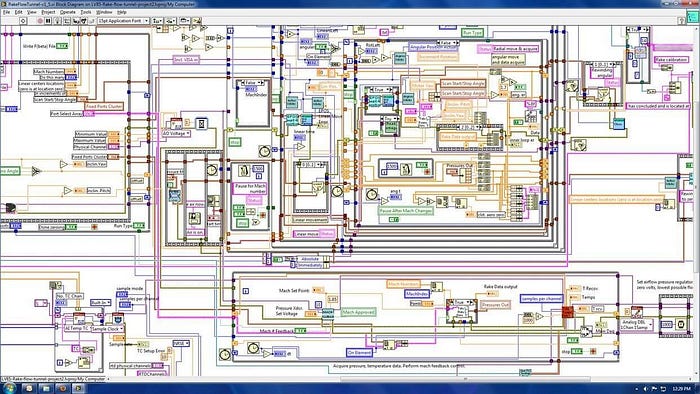
In addition to the key breakthrough of using a PC as a data acquisition platform, the most significant component of this system was a software program called LabVIEW, released in 1986 for the Macintosh personal computer platform.
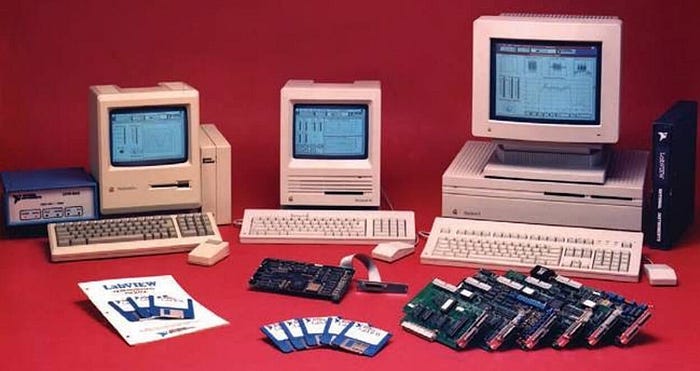
Using LabVIEW, engineers could use graphical programming environments to develop their own data acquisition system (DAQ system), with a wide variety of built-in functions for data processing, analysis and real-time display on the computer’s monitor.
A DOS-based IBM PC version of LabVIEW DAQ software was released in 1989, called LabWindows/CVI, to address the bulk of the PC market.
When Microsoft developed its Windows graphical operating system for the ICM PC platform, the PC suddenly had graphical capabilities more comparable to the Macintosh platform. In 1992 National Instruments released a version of LabVIEW for Windows PCs and has maintained that compatibility ever since.
The Paper Chase — How Paper-based Recorders Responded to Digital DAQ Systems
In the 1990s, paper-based “high-speed” chart recorders, such as those made by industry-leaders Watanabe (now called Graphtec) and Astro-Med (now called Astro-Nova), quickly redesigned their products to incorporate microprocessors. This allowed them on-board digital signal processing and adding flat-screen displays to their high-end products, as a way to compete with PC-based data acquisition systems.
Conversion from Pens to Printheads
In the 1980s the leading manufacturers of oscillographic paper recorders had begun replacing moving pens and the galvanometers that drove them with the relatively new invention called the thermal array printhead. Printheads had been invented to make the fax machine a reality.
The printhead is a rectangular bar which has an array of thermal elements along its edge. At first, there were 100–200 elements (“dots”) per inch but later were increased to 300 dpi (today, printheads are available with 600 dpi). In this system, a blank piece of continuous thermally-sensitive paper is driven by a platen (a solid rubberized roller) across the printhead. When the thermal elements are energized, they heat up and leave a tiny black mark on the paper.
With enough computing power, this allows complex graphics, text and more to be “drawn” onto the paper. Thus, chart recorders utilizing a printhead could suddenly create not just the lines of data on the paper, but could also draw the grid patterns “behind” the lines, text, and other graphical elements.
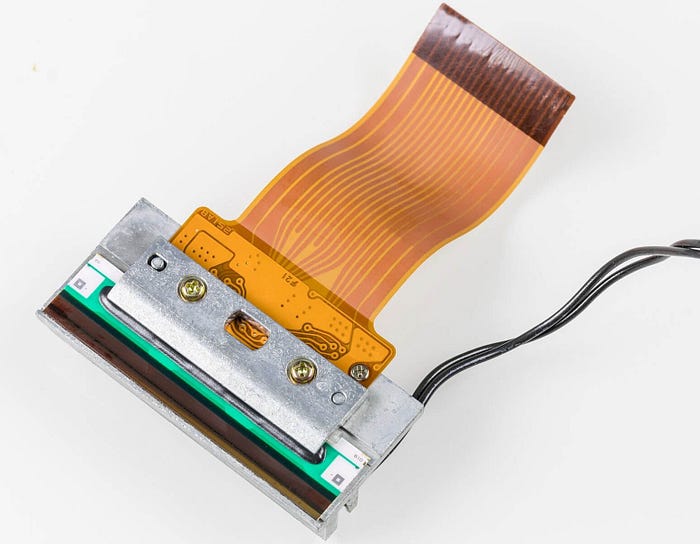
© Raimond Spekking via Wikimedia Commons
Because of printhead technology, DAS companies had their first experience with digital data and had a head start when the movement toward PC-based data acquisition systems began in the early 1990s.
The companies who led the market bringing thermal array printhead technology to the data recorder were Gould, who introduced their TA series, then Graphtec with their WR series and Mark 10, then Astro-Med with their model MT8500.
These companies added computer interfaces such as RS232 and GPIB for remote control and low-speed data transfer. But as engineers became more and more computer savvy, and computer screens got bigger and provided more visual resolution, the requirement for a real-time paper output diminished steadily. Eventually, the chart printing aspect of many of these products became an “option” which could be left out of the product unless needed.
By this time, even the chart recorder makers began replacing the dedicated computer hardware inside their instruments with industrial PC components and developed their data acquisition software like Microsoft Windows applications, which provided a rich suite of development tools.
The Transition From “Do-it-Yourself” to Turn-key DAQ Systems
The advent of LabVIEW and its attending data acquisition components stood in stark contrast with the chart recorders of the 1990s. LabVIEW allowed engineers to create any system, but they had to do it themselves, or pay someone to program it, and then maintain it. The resulting system had no traceable specifications per se unless the engineers hired an outside company to accredit its performance.
Chart recorders, on the other hand, were turn-key instruments with limited feature sets, but they were plug-and-play with no programming required, and they had traceable specifications, especially in the area of accuracy and precision.
Several companies saw this gap in the market and created an integrated instrument based on low-cost PC-components. Most notable among these was a start-up company based in Austria called Dewetron GesmbH.
In 1997 they introduced the PORT-2000, a fully integrated industrial PC with a band of isolated signal conditioners on the back panel, and an industry-standard A/D card inside. The front panel had a flat panel screen for system set-up and real-time data display. The Windows operating system was familiar to engineers and allowed a lot of flexibility in terms of handling the resulting data files.
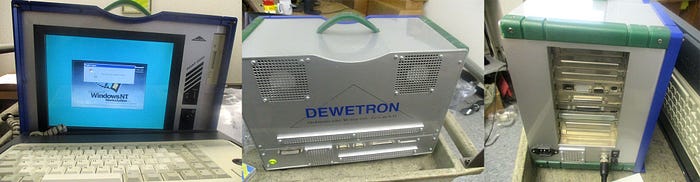
For the first time, PC-based data acquisition was in the form of an instrument, with traceable specifications, and was considered portable in its day.
The weakness of this system, and the other models that followed, was its data acquisition software. Dewetron developed several software programs for its systems over the years, most notably one created using LabVIEW, and another using a competing graphical program called DASYLab (this program has since been acquired by National Instruments).
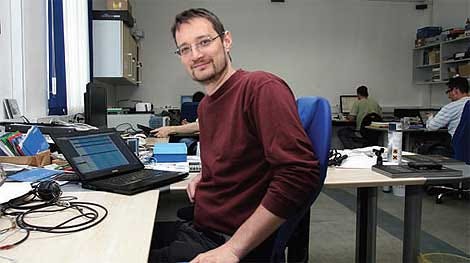
But in 1999, Dewetron principals Franz Degen and Herbert Wernigg discovered a young engineer named Dr. Jure Knez who was already an expert at data acquisition, and had in fact, developed his own software using the Delphi programming language.
Jure created a company called Dewesoft Software and began developing a program specifically to be the data acquisition software for the Dewetron systems. After several test programs, Jure and Dewetron application engineer Gerald Zotzek traveled to the USA to work with Dewetron America president Grant Maloy Smith. Together they have created the overall design of Dewesoft 5 DAQ software. Dewesoft 5 then became the first commercially available version of Dewesoft data acquisition software to be hosted on Dewetron data acquisition hardware.
Throughout the 2000s, this marriage of Dewetron hardware and Dewesoft software was extremely successful, and the companies that used it grew steadily. It was successful not only because of its ease of use, but because both companies innovated, pushing the boundaries of what could be connected to a data acquisition system.
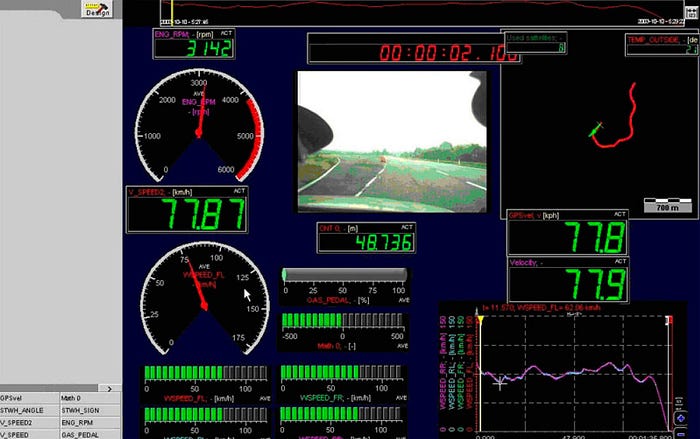
They famously added the common web camera as a sensor, which was revolutionary in the data acquisition industry by adding synchronized video next to the analog signal acquisition. Other interfaces followed, including the CAN bus from the automotive world, which changed everything in the automotive data acquisition sector.
Top 10 Data Acquisition Companies Today
Based on The Data Acquisition Market Forecast research study, the data acquisition market was valued at 1.96 billion in 2019, and it is expected to reach 2.73 billion by 2025, registering a CAGR of 7.28% during the forecast period (2020–2025). Data acquisition systems play a crucial role in real-time decision making in the industrial sector.
The below table lists the most significant data acquisition companies according to market size. You can navigate to the article The Complete List of Data Acquisition Companies to see the updated list of the data acquisition companies.
Company nameFoundedCountryKey productsKey marketsNational Instruments1976USACompactDAQ
CompactRio
PXI systems
LabVIEW software
DASYLab softwareAutomotive
Aerospace
Power and Energy
Transportation
Industrial
Civil Engineering
NVHKeysight Technologies
(formerly Agilent)2014USA
DAQ970A
34970A
34972A
34980A
L4400
M9018A
U2xxxA series
Laboratory
Industrial
General benchtopTektronix
(Keithley Division)1945USAKeithley 2700
DAQ6510
3700AGeneral-purpose
laboratory
IndustrialAMETEK
(VTI Instruments Division)1930USAEX series
CM series
EMX series
RX series
ExLab software
X-Modal III softwareAutomotive
Aerospace
Power and Energy
Transportation
Industrial
Civil Engineering
NVHHBM1950GermanyOdyssey
Vision
Gen3i
Genesis
QuantumX
SoMat
Perception
Catman softwareAutomotive
Aerospace
Power and Energy
Transportation
Industrial
Civil Engineering
NVHLMS International
(Division of Siemens)1980BelgiumSCADAS
Test Lab
Virtual Lab
Test.Express
TecWare software
Automotive
Industrial
NVHBruel & Kjaer1842DenmarkPhoton+
LAN-XI
Sonoscout
BK Connect
PULSE softwareNoise and Vibration applications
across all industriesYokogawa1915JapanDL series
GP series
SMART series
µR series
SL series
Xviewer softwareAutomotive
Aerospace
Power and Energy
Transportation
Industrial
Scientific ResearchDewesoft2000SloveniaDEWE-43A
SIRIUS
KRYPTON
IOLITE
Dewesoft X softwareAutomotive
Aerospace
Power and Energy
Transportation
Industrial
Civil Engineering
NVHBentley Nevada1961USAOrbit series
3500 and 3701 seriesAerospace
Automotive
Engineering
Industrial
Power and Energy
The Complete Dewesoft History
Dewesoft was introduced into the data acquisition world in the late 1990s when it’s founder, Jure Knez, at that time Ph.D. student, found existing data acquisition software solutions to be too complex for a modern, fast-changing world.
Jure started to develop its own data acquisition software (later named Dewesoft 5), with a very simple idea. Data acquisition software should be simple to use and test engineers should focus on testing and improving products rather on programming and maintaining data acquisition software for measurements, visualization, and analysis.
Based on that idea the company Dewesoft Software was born. Dewesoft introduced an entirely new approach to data measurement, storing, visualization and data analysis. With it’s easy to use and powerful data storage, visualization, and processing capabilities, the Dewesoft Software has quickly gained popularity in the industry.
Today Dewesoft company offers complete integrated hardware and software data acquisition products with turn-key DAQ systems that are being used in several industries from space exploration, automotive, transportation, industrial, power & energy, civil engineering, and others.
Below is the timeline of Dewesoft with some major milestones.
The Year 1999
Dr. Jure Knez starts developing a new type of data acquisition software that allows users easily to measure and visualize various signals with a simple drag-and-drop user interface.
The year 2000
Dewesoft is officially founded on December 28, 2000, as a limited liability company, by Dr. Jure Knez, Andrej Orožen, Franz Degen and Herbert Wernigg in Trbovlje, Slovenia. The company is being registered as a strategic alliance partner and provider of data acquisition software to Dewetron (Austria).
Dr. Jure Knez is named as CTO, and Andrej Orožen as the CEO of the company, while Franz Degen and Herbert Wernigg did not assume management positions as they were already the executive directors of Dewetron.
The Year 2001
Dewesoft 5.0 data acquisition software is released. Dewesoft 5.0 is the first marketable measurement software package produced and sold in the USA and Asia markets.
The Year 2002
Dewesoft DAQ software is patented at the USA and EU patent office — the capability of synchronized presentation of all acquired and mathematically transformed signals on a personal computer (PC).
The Year 2003
Dewesoft 6.0 data acquisition software is released. Version 6.0 adds essential features suited for automotive, telemetry and power measurements and power analysis.
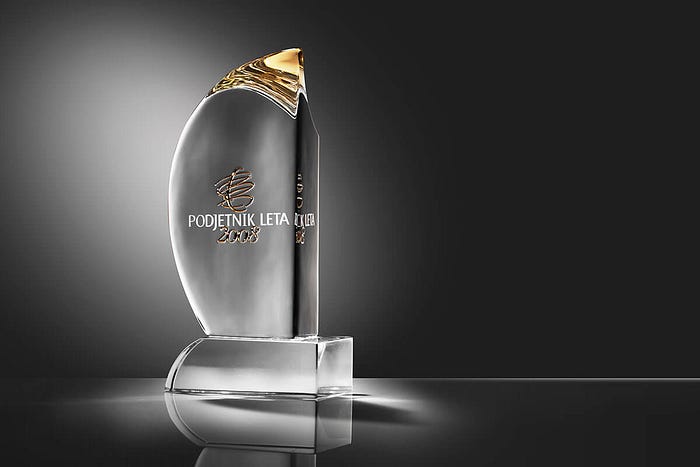
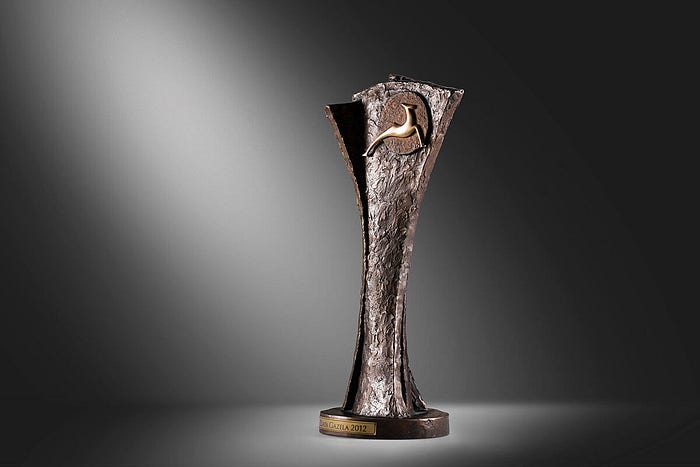
Dewesoft receives recognition from the Finance Business Daily Newspaper in Slovenia for its entrepreneurial excellence.
Major Breakthrough — The Digitalization of NASA Telemetry Systems
In the 2000s, PC-based data acquisition systems steadily replaced paper-based systems. These systems brought lower operating costs because their large, high-resolution flat-panel displays eliminated the need for expensive rolls (or folded packs) of continuous paper and maintenance of the mechanical paper drive. In cases where a hard copy might be needed, PC-based systems are able to print any part of the data to a standard office printer using low-cost supplies purchased in bulk.
One of the most significant changes was the replacement of 25 paper-based recorders at NASA’s Kennedy Space Center in 2003 with PC-based digital data acquisition systems, in the RPS (Record and Playback System Room) at the LCC (Launch Control Center).
Opened in 1965 for the USA’s manned missions to the moon, the LCC has played an essential role in every space initiative since, including the Space Shuttle program, the International Space Station, and the upcoming return to the moon and missions to Mars.
Twenty-five model DEWE-4000s made by Dewetron replaced old paper recorders at the LCC. These systems were based on Dewesoft 6 data acquisition software from Dewesoft.
To complete this modernization, the DAC (digital to analog) converters that were used for decades had to be eliminated. Because the paper and tape recorders from the 1960s had only analog inputs, DACs were historically needed to convert the spacecraft’s digital data telemetry stream from digital to analog.
Since the new PC-based data acquisition systems were digital, It, therefore, made sense to develop a direct digital interface for them, so that they could directly accept digital telemetry data and even high-speed network data from NASA’s SCRAMnet interface.
Accordingly, Dewesoft engineers were commissioned to work at NASA and develop these interfaces within the newly acquired DEWE-4000 systems. These software upgrades, still in use today, allow NASA engineers to configure the acquisition of hundreds and even thousands of channels from the telemetry stream within each of the DAQ systems being used at NASA. This same telemetry interface is also in use today by Dewesoft’s clients around the world in both the aerospace and defense sectors.

Dewesoft made the first visit to NASA Kennedy Space Center in Florida for a telemetry project. NASA had undertaken a modernization of the entire Telemetry Processing System for the Space Shuttle program. Dewesoft was one of the bidders and was later selected as the winning supplier of the solution.
Read more on the final telemetry solution that Dewesoft deployed at NASA in the NASA PCM Telemetry Processing Systems case study.
The Year 2007
The ownership structure of the Dewesoft company is changed. The first software development engineer receives a 2% share of the Dewesoft company.
Dewesoft develops a new mission statement whereby they intend to focus on integrated hardware and software devices and systems to perform special measurement tasks.
The Year 2008
Franz Degen and Herbert Wernigg, Dewetron’s founders and long-time CEOs leave the Dewetron company.
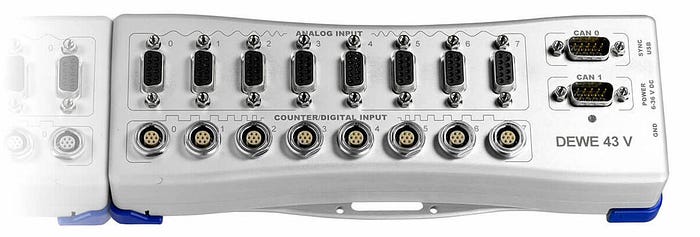
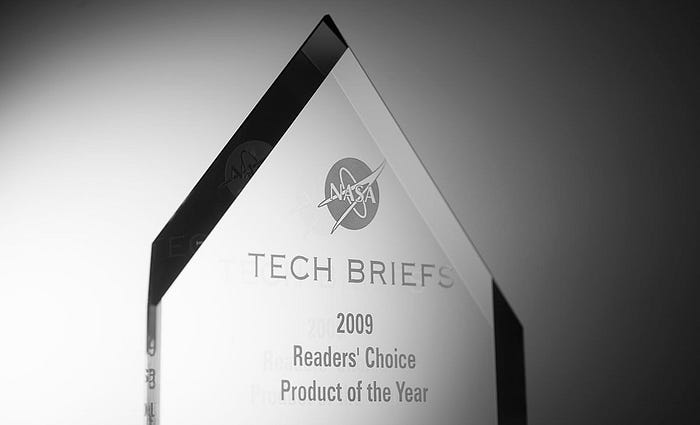
Dewesoft successfully develops its first data acquisition hardware called DEWE-43 — multichannel data acquisition system which is still being very popular today after several hardware revisions. The DAQ instrument was later awarded the international “Product of the Year” award by NASA’s Tech Briefs magazine.
Dr. Jure Knez and Andrej Orozen receive the Slovenian Entrepreneur of the Year Award.
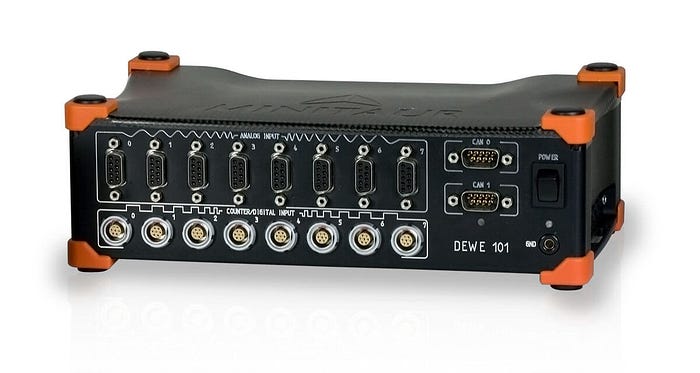
Dewesoft releases the MINITAUR (aka DEWE-101) multichannel data logger instrument. Minitaur combined DEWE-43 DAQ hardware with built-in PC and SSD storage.
The Year 2009
The Dewesoft online webshop is launched for selling the DEWE-43 and MINITAUR data acquisition systems.
Dewesoft Austria opens as the first independent international direct sales and support office of Dewesoft.
DEWE-43 was awarded the Instrument of the Year award in the technical journal NASA Tech Briefs Magazine.
Dewesoft 7.0 data acquisition software is launched with a completely overhauled graphical user interface and new capabilities.
The Dewesoft Hong Kong direct sales and support office is opened.
The Year 2010
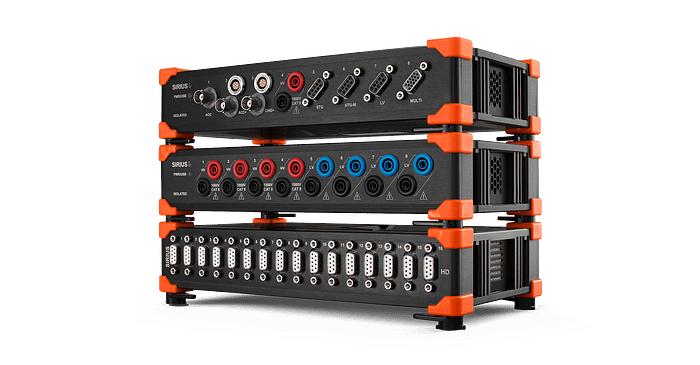
The SIRIUS data acquisition system is introduced. SIRIUS is a powerful and versatile system connecting to computers via USB and/or EtherCAT and with Dewesoft’s DualCoreADC technology. It is the first measuring instrument to be sold and marketed entirely under the Dewesoft brand.
SBOX SSD data logger with a powerful data processing computer launched.

The Dewesoft Singapore direct sales and support office is opened.
The Year 2011
Franz Degen and Wernigg sell their Dewesoft shares and assume the roles of Dewesoft managers.
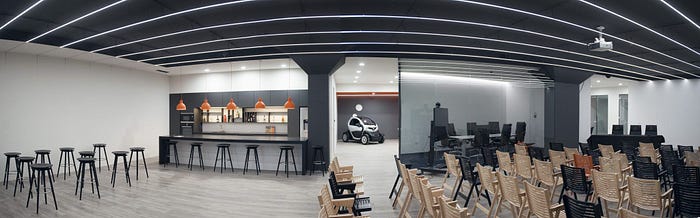
The company’s 10th anniversary is celebrated with the first international Dewesoft Measurement Conference in Trbovlje.
The Year 2012
The new data acquisition software package Dewesoft X is launched. The Dewesoft X DAQ software is a breakthrough in the history of Dewesoft. For the first time, Dewesoft has completely abandoned support for 3rd party analog DAQ hardware. Dewesoft X supported exclusively Dewesoft DAQ hardware and enabled the fast development of future data acquisition technologies.
Dewesoft software is no longer commercially available but is instead given to customers free of charge as an application for acquired data acquisition hardware with lifetime free upgrades.
Dewesoft receives the Golden Award for the Fastest Growing Company in Slovenia from the Dnevnik daily newspaper.
The Dewesoft Germany and Dewesoft USA direct sales and support offices are opened.
The Year 2013
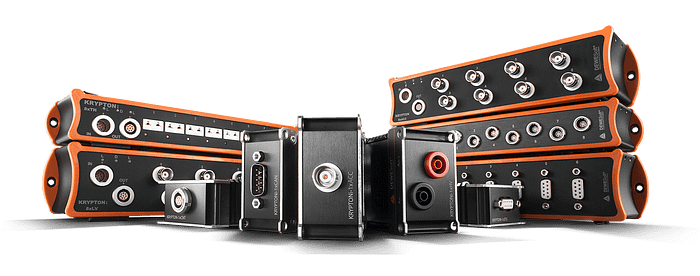
KRYPTON — a family of data acquisition modules based on EtherCAT technology for distributed and field measurement acquisition is launched.
In August, the second international Dewesoft Measurement Conference is being held in Trbovlje Slovenia, hosting over 100 measurement professionals from around the world.
The Year 2014
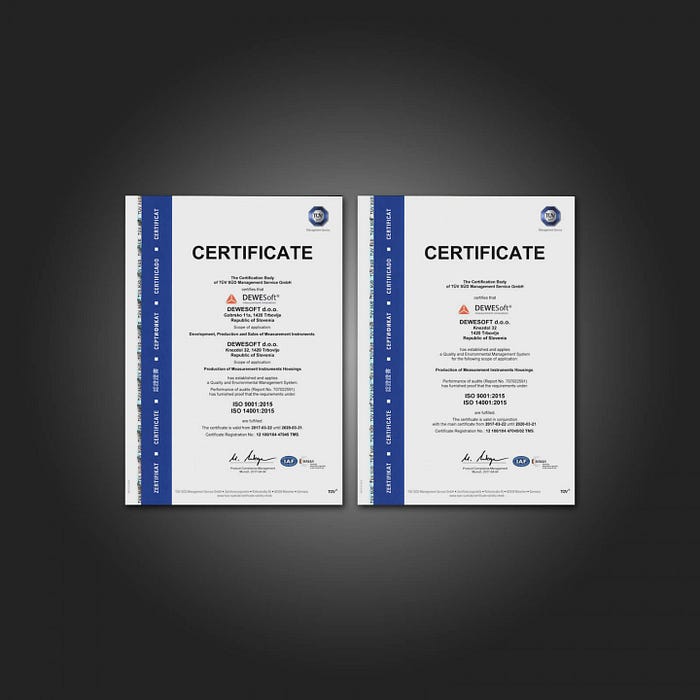
The Dewesoft company completes ISO audit and receives ISO certification on standards 9001 and 14001.
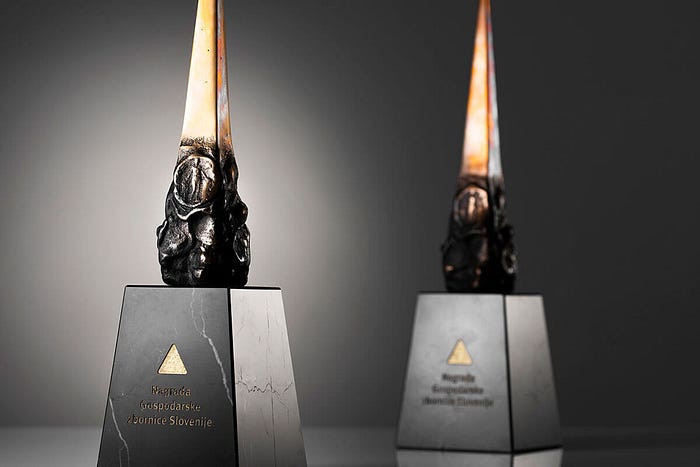
Dewesoft is honored with the Slovenian Chamber of Commerce award for entrepreneurial and business achievements.
The Year 2015
The company has now direct sales and support offices in Austria, Germany, the USA, Singapore, and newly opened Taiwan. In addition to having representatives in 38 countries worldwide.
Dewesoft launches the R2DB DAQ system. R2DB is a compact, mobile data acquisition system with a built-in data logger and powerful data processing computer.
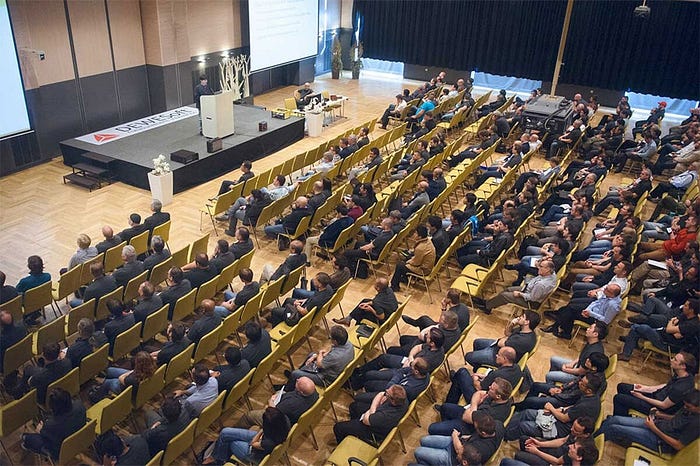
In April, the 3rd international Dewesoft Measurement Conference is held in Laško, Slovenia. Over 200 measurement professionals from around the world join to see the latest in data acquisition technology.
Dewesoft X2 data acquisition software is launched.
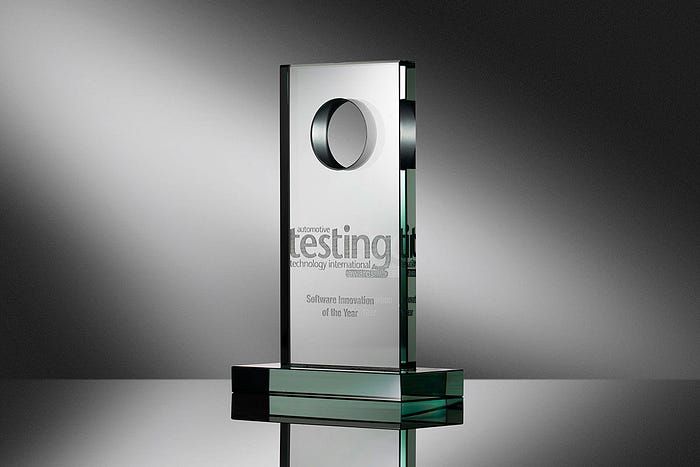
Dewesoft X2 software is awarded software innovation of the year award by Automotive Testing Technology International Magazine.
Dewesoft opens a spin-off company called MonoDAQ. MonoDAQ designs and develops entry-level data acquisition systems powered by Dewesoft’s Dewesoft X data acquisition software.
The Year 2016
KRYPTON ONE — a rugged and distributed EtherCAT data acquisition system modules for field measurements is launched.
The company begins the process of changing ownership, with co-founders and majority owners, Dr. Jure Knez and Andrej Orožen, making it possible for employees to buy shares.
The Dewesoft Brazil direct sales and support office is opened in the city of Sao Paulo, Brazil.
The Year 2017
Dewesoft builds the concept and financially backs the business accelerator Katapult in Trbovlje to support local hardware startups.
70% of the Dewesoft employees buy company shares and become company shareholders.
The Dewesoft opens direct sales and support offices in Sweden and the United Kingdom.
The Year 2018
The 4th international Dewesoft Measurement Conference is being held in Laško, Slovenia. Over 400 measurement professionals from around the world gather for a week and discuss and witness future data acquisition technologies.
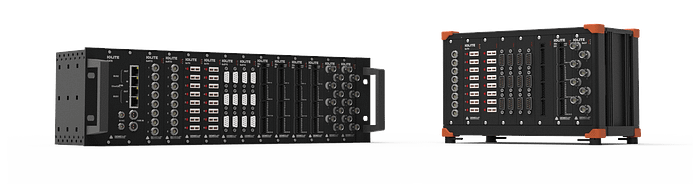
IOLITE data acquisition and real-time control product line is launched. IOLITE merges data acquisition and real-time control front-end systems for industrial data acquisition applications.
The Dewesoft opens direct sales and support offices in Belgium, Denmark, India, and Italy.
The Year 2019
Dewesoft acquires the Austrian companies TVE Elektronische Systeme GMBH and DEWEnet.
Dewesoft’s KRYPTON ONE series of ultra-rugged, single-channel data acquisition models win the Product Of The Month award in NASA Tech Briefs Magazine.
The Year 2020
Dewesoft announces the 5th international Dewesoft Measurement Conference 2020 in Laško, Slovenia.
The Dewesoft Mexico direct sales and support office is opened in Mexico City.